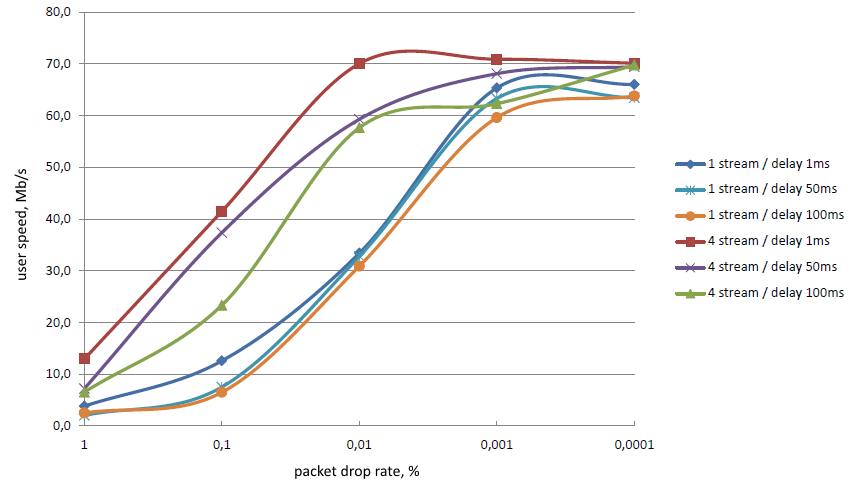

Lack of bandwidth, degradation of line, high utilization of equipment are causes of deterioration of the transport network and, as a consequence, deterioration in the quality of services. The subscriber speed in the 4G network is very sensitive to packet loss rate and delay. To maximize service quality transport network should have minimum losses and delays.

Often problems in the transport network can be identify and remove only when they have a significant influence on the performance of the base stations (BS). Each problem is considered in isolation, which does not allow to see the state of the transport network as a whole. To find the causes of the problem it's necessary to conduct a full analysis of the way the BS inclusion. It's inefficient and expensive.
Merging statistics of BS (counters IUB LIMITINGS, GTP LOSS) or collected with tools for analysis of service quality (e.g. TWAMP), with the transport network topology allows Genesis to make a quick analysis of the existence of problems and their causes. Not only to each BS-also on the entire network.
Genesis will allow to eliminate most of the problems before they will have a marked influence on services.

Currently, Genesis is in test operation on the network of one of Russian mobile operator in St. Petersburg.
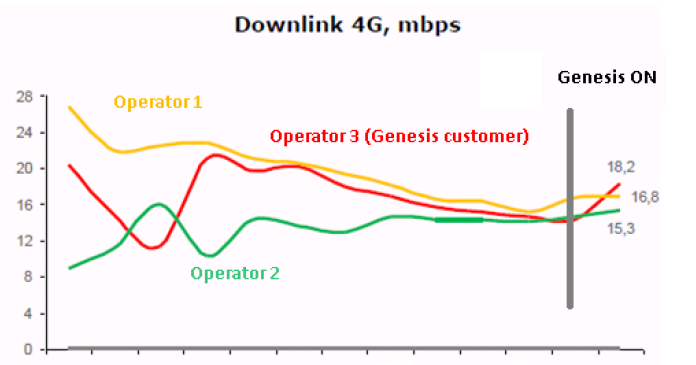
The graph shows a significant increase in the average 4G speed after starting the Genesis (SpeedTest statistic).

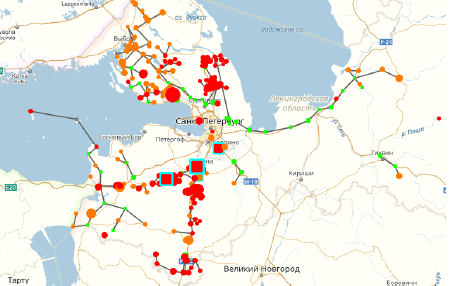
Graphical display allows you to group problems.

In this example, during the operational analysis for 20 minutes 5 major causes of degradation of quality of service identified. To eliminate 4 of 5 reasons not required network upgrades -just the adjust the parameters of the existing equipment.
The user interface is designed to maximize comfort and performance. Main sections:
Visit the online demonstration of the system:
Login: demo
Password: demo